
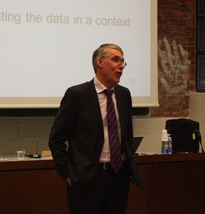
 Mr. Peter van de Ven, the head of the national accounts division at the OECD. As such, he is responsible for the statistics on National Accounts, Purchasing Power Parities, Prices and Composite Leading Indicators • S: You talked about the special media attention devoted to indicators such as government debt and deficit. There is currently a certain “competition” among OECD countries to improve indicators. Which effects have this media attention on your work as head of division of National Accounts? Van de VEN: That's not an easy question and there are many ways to look at it. If we have a look back at my 30 years of experience I can see a couple of developments. First, the media attention for our data has increased significantly. You can also see that there is a cry for more and more recent data. When I started in National Accounts (NA), our first results were published six months after the end of the year and were related to annual data. Now it's all about quarterly data, so there is a certain pressure to come up with more and more timely data. Nowadays, within Europe, for example, first estimates for quarterly growth are published six weeks after the end of the quarter (so from six months after the end of the year, to now 1.5 months after the end of the quarter). This has also to do with the growing importance of data in general, NA data in particular. There is a lot of attention and I think in general one can say that the quality of data and its reliability has improved considerably. This is most certainly true for the international comparability of data between (European) countries, among others because of international standards. There are also a lot of controls and procedures. But on the other hand, this pressure to come up with more and more timely data necessitates relying on less resource data. That means that you have to make more estimates. Statistical offices usually review the difference between the first estimate and the final estimate. The final estimate usually is compiled only 3 or 4 years after the relevant period and what you see is typically that the first estimate differs from the final estimate in a range of +/- 0.5 %. So, because of this difference, if people attach a lot on e.g. minus 0.1%, I say: let's see what we get when we have the final estimate. This difference is actually not so bad, let's say in a range of +/- 0.5%, it becomes worse if you have a systematic over- or underestimation. Let's take the Dutch example: what we saw, when we made comparisons for the last 10-15 years, was a systematic underestimation. The first estimate was an underestimation of 0.5% on average, our range was roughly between 0 and 1%. What you do then is you look closely at your estimation methods and you try to improve them in order to get rid of this systematic bias. • PH: Is this media attention typical for Europe or do you observe the same phenomenon on other continents? Van de VEN: No, the same is true all over the world. Actually, the U.S.is producing even quicker estimates: like the UK they produce them 30 days after the end of the quarter, but often they can have significant revisions later on. In the U.S., the data on economic growth are far more important, than the ones in Europe because they also directly affect stock markets. So when they compile their estimates, they make sure that nothing gets out before it is published and everybody gets the data at the same time and they physically lock the room and journalists may even come in to be the first ones to see it but they cannot get out. • S: You mentioned during your talk the Excessive Debt Procedure (EDP) within the EU Stability and Growth Pact that focus on government debt and deficit. You said it would be better to focus on net savings and on net debt instead. Do you think that these alternative indicators would change policy proposals, that they may have different effects on the resolution of the crisis? Van de VEN: Perhaps not the change to net savings and net debt as such, but looking at a broader picture would perhaps have an impact. Now the focus is almost entirely on this gross debt and deficit, and that seems to have some impact on policy as well. In the presentation, I mentioned the example of Eastern European countries, where they had a pension reform. They tried to set aside part of the pension contributions in a separate fund and to create a real fund for the payment of future benefits, which seems to be a very sensible policy from an economic point of view. However, that also had a negative impact on government deficit and then you get closer to this benchmark of 3 percent. When the crisis started with the accompanying pressure on government deficit, some of them decided to stop this economic policy and even reverse it. The latter actually had a very positive effect on deficit. This change of policy is a pity. If you would take a broader picture and take into account what we call implicit pension liabilities, which are not recognized as debt in the system, if you would take those into account, then you probably wouldn't have this negative impact on policy. • PH: Do you think that the Euro debt crisis enforced the discussion whether indicators such as debt, deficit as well as GDP growth are appropriate or did this discussion start already before? Van de VEN: I think that this discussion already started before. The relevant indicators have been chosen at a political level at a certain time after a lot of political debate. But they finally agreed about it. Afterwards, we had something close to a “crisis” with at the front France and Germany crossing the three percent barrier, and a lot of discussions. If you open up this agreement, you would open up a box of Pandora and I think politicians are not inclined to do that. They have agreed on it: so, let's stick to it. However, because the indicators are so heavily used, so strongly politicized, they lose some of their usefulness. • PH: Why do you use at the OECD another definition for debt as in the Maastricht Criteria? Van de VEN: It is the other way around. For NA, you have international standards. They are called the System of NA (SNA); the one, which is now applicable, is the SNA 1993. Based on these standards a European equivalent has been produced, the European System of Accounts (ESA) in 1995. The standards are the same as the one in SNA 1993, but it is in some respects more precise in its definitions. Basically that's the system one has to apply for the calculation of NA in the European Union. When they set up that agreement on deficit and debt they did not take for debt, for example, the full definition, as it is included in the core system of NA. They excluded, for example, other amounts payable, they used a quite specific definition, we call it the Maastricht definition. The Maastricht definitions are pretty close to the NA definitions, but they are not fully the same. We have now changed the standards to SNA 2008 and ESA 2010, that will be introduced in Europe in 2014, and they try to bring the definitions together as much as possible, because it creates a lot of confusion. Take, for example, government deficit. There is a difference between the deficit according to the SNA/ESA and the Maastricht deficit related to the recording of derivatives. Everybody gets confused and you want to get rid of it. Hopefully we can achieve that. • PH: What about the structural deficit? Van de VEN: You could look at it in different ways. Eurostat for example is looking at having seasonally adjusted quarterly deficit figures. That's one thing; you can imagine that if you look at quarterly deficit, it bumps up and down with taxes collected in a certain quarter, so you want to remove those cyclical movements. But you probably refer to deficit figures which are adjusted for business cycles, output gap movements. I'm not really involved in that line of business. • PH: In each Euro Area member we have currently a national statistics authority depending on and supervised by the government in power. Do you think that a more independent model could lead to an improvement of the quality of statistics delivered to Eurostat (and the OECD)? Van de VEN: Actually you have different models in the EU and also outside Europe, and sometimes you have very formal arrangements, which make the statistical office or statistical authority more independent. Consider, for example, the Netherlands: the statistical office is connected to the Ministry of Economic Affairs but it's a separate legal entity. The Ministry of Economic Affairs cannot influence the statistical program. In France you may have a different model, but INSEE is also known for being independent. When you look at Greece, one of the first things that was done after the events in the end of 2009 was to create a legal structure in which the statistical office would become more independent. But, of course, you can create a nice legal structure, but still it depends on how people interact. It is also a part of culture. In the Netherlands for example it is very much accepted that we take an independent view and the Ministries also respect it. Of course they sometimes also try to influence but it is clear that we take the decisions in e.g. the recording of government transactions, and it is not someone else. But you can have a different culture. Let's assume that the Ministry of Finance of the Netherlands wouldn't be happy with what I do as director of national accounts, and they would try in some way to get me out of business, and I subsequently would go to a newspaper, I wonder who has the biggest problem: I or the Ministry? I don't know how it is when something like that would happen in other countries. You must realize that is all part of the game that the Ministry of Finance tries to influence things. On the other hand, as a statistician, you have to be firm and act independently. • S: If you cross the three percent thresholds, or just below, it may be easier to be strict with definition of independence. Do you think that for example in Greece, a higher deficit is correlated with higher political danger? Van de VEN: It’s perhaps also part of economic culture. I take the example of Germany where some time ago you did have a debate on how to move forward: we are not as competitive as we used to be, what should be done, how should we address this? You had very moderate wage increases for a longer period of time, which did improve the competitiveness over time. To address these issues in the political arena and to find a solution, that’s very important. I have the feeling, however, that it becomes more and more difficult. This is a more general observation that doesn't have anything to do with statistics as such: we need more substantive political debates on fundamental issues, how to address and solve them. That is very difficult in an environment where much is very focused on the short term and people tend to think how does that affect my income or my situation. These fundamental issues are real societal issues that need to be addressed. It needs a lot of political courage to address issues like the ageing society and how to deal with it. You see that sometimes happening under the pressure of an economic or financial crisis, like the current discussions about retirement age, but it is not easy. • S: What are in general the job opportunities at the OECD for young economists, and especially in your department? Van de VEN: Let me first say that a former TSE student is actually working in my division. To enter at the OECD you would normally apply for a job and it would be good to bring some experience in the relevant field, since the competition is quite substantial. People like to come to work at the OECD. Another way to pursue this would be an internship of e.g. 6 months. By this, people see the work you are doing, you can learn on the job and collect experience. If you perform well and there is the need for an auxiliary you may be asked if you would like to do this for some period of time, and then there is perhaps a job opening where you could apply. Your chances for getting a job in the OECD increase significantly if your future employer knows you already and knows that you very capable. • S: Would you rather say that the OECD is a job opportunity for people recently graduated from university? Van de VEN: There is Young Professionals Program (YPP), which is an OECD broad program. There are a lot of applications for that, usually only the best people are taken, and the best people are usually those who have a couple of years experience in the field for which we look for young professionals. Sometimes they bring PhD etc., so we are really looking for the best people to apply. It is not easy for a fresh graduate to enter the OECD, I would say, but you never know. • S: It is really specialized work? What skills, either acquired at university or during other professional experiences, are required from economists in your division? Van de VEN: As a junior economist in my division you would typically be involved in the processing of data from countries, member countries and the BRICS countries. We send out questionnaires, we get the results, these results have to be checked whether they are appropriate, they need to be published on our databases. Usually, it also involves contacts with the relevant countries, to discuss (some particularities of) their data. What I try to do within my division, is to bring more attractiveness to the job, in the sense that people do not only work on data the whole day but also do some analytical work on e.g. the international comparability of data and the caveats when you compare data across countries, and to do related publications in that field. That is something I am currently working on. • PH: The OECD is located in Paris, do you work together with other statistical offices in Europe such as Eurostat or AMECO? Van de VEN: My work is perhaps for a half about cooperation with other international organizations. One of the things we are working on is to have a better co-operation with other international organizations in, for example, the collection of national data. In this respect, a lot of OECD members are also EU members and what you now see is that Eurostat collects the data, we collect the data, and that is not very efficient. So we are now in a process where we discuss with Eurostat, looking at our procedures (what do we do, what do you do?), try to improve it and in the end Eurostat will become responsible for the data we use for the EU countries. But this involves a lot of discussion between the two organizations and involves quite a number of people working on this kind of statistics. There are also a lot of cooperation in the compilation and further development of the NA standards worldwide. For this purpose, there is a group active, the so-called “Inter Secretariat Working Group on National accounts”. It consists of five international organizations: Eurostat, OECD, World Bank, IMF and UN and they take responsibility for the standards. When you look at these standards, it is a rather complicated process to change them, because they are applied worldwide. To involve countries in the process, an advisory expert group consisting of 15 to 20 NA experts worldwide discusses all topics in detail. If they have come up with a new revised set of guidelines, then this has to put forward for agreement to the UN Statistical Commission where all countries are represented. Especially in the area of NA, you have a lot of exchanges between countries and between international organizations. • PH: When, during your studies, did you decide to specialize in NA? Van de VEN: For me it was already clear when I was 16 or 17 years of age that I wanted to do macroeconomics. I was during my studies very engaged and I was very interested in economic policy oriented questions like government debt, unemployment or economic growth. I was always very fascinated by the topic. During my studies I hardly heard of NA. Well, then you start to apply for a job and actually my first interest was to get at a job at the Netherlands Bureau for Economic Forecasting and modeling. NA is a fascinating countrywide kind of book keeping system; the system really is a beauty of elegance, absolutely beautiful. In bookkeeping you have the double entry principle. Every transaction is recorded as an income/outlay with a concomitant change in financial assets/liabilities). With this identity, you can check whether data are complete and consistent. In NA, it is all quadruple entry, because every transaction involves always two parties: if you receive interest, somebody else is paying the interest. So, every transaction is recorded four times. However, I must say that while I was studying, the famous equation Y=C+I+(X-M) was something totally abstract for me, but when you enter into NA it becomes very concrete because it is that equation which we use the whole time when we process data. It is the basic equation of supply equals demand and what we do is trying to arrive at consistent data in which: Domestic Production (P) + Imports (I) = Intermediary consumption (IC) + Exports (E) + Investments (I) + Consumption (C). We use this identity all the time when we compile NA. We have statistics on how much is domestically produced, we get foreign trade statistics, we get household budget surveys which give information on the purchase of goods by households, we have enterprise statistics, etc., etc. We put all this information in the system of supply and use tables, and what you will see that it does not match and then we have to decide which data need to be adjusted. To give an example, if you look at cigarettes, then you would typically see that supply is larger than demand. Consumption of cigarettes is typically underestimated and we typically increase consumption, to arrive at consistent data. This equation is very important in NA. It's is also a way in which we can sometimes detect hidden activities. • PH: Given your experience, would you recommend TSE students to remain generalized in the large field of economics or rather to specialize? Van de VEN: My personal impression is that, especially when you look at people from the university, it is not that important what they exactly have studied. It is much more important that you have the impression “This is smart young lady or a smart young man.” In my field of expertise I do not expect that people know a lot about NA, but I want them to comprehend the system quickly, that they quickly get up to speed and really bring value added to the work we do. Of course it helps if they know something about consumption or exports, but they usually do not know the details. I could even take somebody who studied physics if I know that he/she is a smart and has a certain quantitative feeling. You should not be afraid of numbers and computers. It certainly helps if somebody has done macroeconomics, but it is more important to comprehend fast. Maybe this is different in more specialized fields. • PH&S: On behalf of the TSE students, thank you for your time, it has been very insightful. Important Note: Mr. Van de Ven is actually looking for an intern, starting June 2013 (or somewhat later) for a period of about 6 month. The main tasks will consist of providing support in the update of the OECD-publication "Understanding National Accounts" (available on the OECD-website). If interested, please contact him at [email protected].
As mentioned previously, to do an internship at the OECD requires you to be a national of a member country of the OECD. More information about the OECD available at the following website: http://www.oecd.org/
0 Commentaires
Peter van de Ven (OECD), Government finance indicators: the truth about the myths (8/02/2013)2/17/2013  In the business talk on the 8th of February Peter van de Ven addressed an important macroeconomic issue, which has nowadays more relevance than ever: government finance indicators. In his talk he promised to debunk some of the myths surrounding those indicators and provided some new insights in the relevant parts of national accounts (NA). Peter van de Ven is an expert in this field, working almost 30 years in the area of NA. He started his career in the NA department of Statistics Netherlands and served in several leading positions before becoming head of the NA division. In July 2011, he joined the OECD, to become the head of the NA division over there.
In today’s information age statistics are thriving. Economic indicators are nowadays in the center of attention and the media coverage is rising and therefore also the demand for more and more recent data. Analysts make a big effort to interpret and forecast economic trends and statistical offices dramatically increase the amount of data and metadata they process and publish. Among OECD countries there is a strong tendency to produce more accurate and timely indicators. The two major indicators used in the analysis of government finance within the European Union (EU) are Government Deficit and Government Debt as a percentage of GDP. These indicators are politically extremely important; consider, for example, for the EU Excessive Debt Procedure (EDP), i.e. EU Member States agree under the Stability and Growth Pact respecting two criteria: a deficit of 3 percent (of GDP) and a debt of 60% of GDP. The question is if such an extensive focus on numbers and percentage points is healthy for countries and whether the relevant indicators are indeed the most appropriate ones to use. Right from the start of his presentation Van de Ven made it clear that the debate on government debt and deficit surely has some value added but is nevertheless mostly overrated. Van de Ven motivated this talk by telling anecdotes on what happens when politics and statistics come together. Statistics become a very political issue especially when the data is on very sensitive topics such as government deficit and debt. The “success” of governments seems to be measured by the level of those two indicators and therefore governments have great incentives to make the numbers look as good as possible. Van de Ven compared the advantages and disadvantages of the use of NA data to make a judgment of the appropriateness of the use of government finance indicators. He mentioned that the extensive attention lead to considerable improvements of the quality of the data and also their international comparability. It is also good that there is now more awareness of the importance of statistics and the insights they can give. Also legal structures have changed as a response to this new awareness: statisticians can nowadays be prosecuted if they purposely produce wrong data in relation to deficit and debt. However, Peter van de Ven drew attention to the fact that there are also problems going hand in hand with the extensive interpretation of NA data. First of all, the allocation of resources within statistical offices has changed. There is a lot of money spent on statistics for “administrative purposes” whereas the focus on research is more and more losing its prominence. In addition, since the indicators are used at EU level, e.g. to calculate the contribution of the Member States to the EU budget, governments have an incentive to go for “exactly wrong” instead of “approximately right” estimates, when it comes to, for example, including new economic developments in the system of national accounts that are difficult to measure. In practice countries are also continuously looking for “grey areas” to “manipulate” the relevant NA data. They create constructions that have a lowering impact on the deficit. For instance, they could sell government buildings making a surplus but then lease them back. From an economic point of view, however, this may not be a wise decision, when the leasing rates are higher than the annual costs of owning the buildings. Another way to use those “grey areas” is the recording of Public Private Partnerships (PPP) where private companies make the investment in e.g. transport infrastructure. Van de Ven mentioned in this talk also the example of France Telecom “trick”, which was copied by several other countries. In 1996 France Telecom made a huge one-time payment to the government and in return the government was shouldering its pension liabilities. Therefore the deficit was reduced and since the future pension liabilities of the government were not included in government debt this effort enabled France to meet the 3% Maastricht criteria. It can be shown that this trick accounted almost for half of France’s deficit reduction in 1997. Given some of the disadvantages of using government debt and deficit as main indicators, Van de Ven proposed instead to use two different indicators: net saving and net debt. Net saving are current incomes minus current expenditures (including depreciation). This would be a more appropriate indicator, as it would exclude investments that may be important to generate future income. It would also be a fairer indicator for emerging economies. Furthermore the present debt indicator does not include all liabilities and gross debt does not take into account the asset holdings of the government. Therefore, it would be more appropriate to use net debt meaning gross debt minus financial assets. He underlined his argument by showing the discrepancy between net debt and gross debt. One striking example is Norway with its huge funds due to the oil reserves; the difference between these two indicators is about 194 percentage points. Also Japan, known for its huge debt would be located at a much more decent level using net debt instead of gross debt. In his concluding remarks Peter van de Ven said that as a statistician he would stop focusing on a few indicators and put the data in context. More story telling around the data may be capable of creating a broader picture for a better analysis and tailor-made policy measures. Many improvements have already been already made and this discussion is an important step forward to ameliorate indicators. In the following Q&A round the speaker answered many questions from the audience. He explained that the focus of a statistician as well as a politician should lie on the well being of people. Today’s world is obsessed with GDP growth as indicator of economic growth and performance and the news coverage makes you believe that there might be a connection between well-being and GDP growth. Peter van de Ven commented that there is certainly a relationship between the two but the relationship is not linear. GDP growth is an indicator for economic activity but does not give insights on environmental issues like pollution, nor does it say anything on health or distribution of income and wealth. An important step forward would be, for example, to rather focus on households and their real disposable income as an indicator, instead of GDP growth. The talk was very insightful and gave fruitful thoughts. On behalf of all TSE students we would like to thank Peter van de Ven for coming to TSE to share his thoughts and talk about his work as an economist at the OECD. Work at the OECD The best way to gain insight in the work at the OECD is through an internship of several months. You can apply online under http://www.oecd.org/careers/internshipprogramme.htm. For internships starting in July 2013, for instance, applications will be considered starting March 15. The people working at the OECD are around 90% university graduates and often inherit a PhD. The OECD has a young professional program (http://www.oecd.org/careers/oecdyoungprofessionalsprogramme.htm), which offers many opportunities for university graduates. However, these programs are very competitive since the OECD is a favored employer. It is a desirable place to work due to the international working environment and the advantages of working for an international organization. Moreover, for you to become member of the OECD staff you have to be a national from one of the member countries of the OECD. MARC LEBOURGES, DIRECTOR OF EUROPEAN AND ECONOMIC REGULATION AT FRANCE TELECOM ORANGE (1/02/2013)2/11/2013  On Friday 1st February, a surprisingly warm winter afternoon, Marc Lebourges, Director of European and Economic Regulation at France Telecom Orange, greeted a room full of TSE researchers and students to begin the first of the New Year’s Business Talks on the issue of Net Neutrality. Net Neutrality has been at the centre of a heated debate which originated in the US, but has now made its way over the Atlantic and will undoubtedly become a key focus in developing countries in the near future. In the literature, Net Neutrality refers to the fact that ‘internet service providers (ISP’s) charge consumers only once for Internet access, do not favour one content provider over another, and do not charge content providers for sending information over broadband lines to end users (consumers)’ (Wallsten). Advocates of Net Neutrality have raised the issues of freedom and democracy but the economic literature has focused on two main issues. Transferring information through the Internet requires infrastructure and this is obviously finite in supply. The first element of Net Neutrality is the “zero pricing rule”; content providers are not charged. Some of the literature considers whether the necessity of traffic management justifies ISPs charging content providers a fee proportional to the volume of traffic they generate. This is considered as a cost allocation issue in a two-sided market framework with imperfect information; should it be content providers or consumers who pay? Bruno Jullien, a TSE and IDEI researcher, is currently working on a paper in this area. The second characteristic of Net Neutrality is around the issue of “no discrimination”, i.e. the same access speed for all users. The literature considers whether ISPs should be able to adopt a tiered system; for simplicity, imagine a two-tiered system for transporting traffic, a ‘fast-access’ and ‘slow-access’ connection speed. The focus of the literature has been on whether this is welfare enhancing and, in particular, whether it leads to incentives to increase the capacity of the network. If the ISP is able to discriminate, then it can generate more revenue and therefore becomes incentivised to invest. However, the ISP could provide a very low quality slow-access in order to force people to pay for the fast-access. If the ISP cannot discriminate, it may find it optimal to not invest at all, resulting in a uniform but slow service for all users. Broadly speaking, proponents of Net Neutrality are Over the Top (OTT) companies such as Google, Amazon, Skype, Microsoft and eBay, as well as consumer groups, while opponents are telecom and cable companies (such as Orange). Orange supports a neutral Internet and thinks it has provided Internet access on a rather universal basis. In his presentation, Mr Lebourges was very considerate and fair in his argument and made clear the issues that Orange faces. Orange believes a sound pricing system is the best long run solution to guarantee neutrality. Despite considerable industrial and academic research no definitive conclusion has been determined at this moment. Industrial groups related to the Internet, IT and Telecommunications are experiencing growth throughout the world. The only area that seems to be experiencing a contraction is Telecommunications in Europe. This is evident when considering the major European players: France Telecom, Dutch Telecom, Telefónica, Telecom Italia and KPN. Apple represents just 40% of their combined revenue but is a staggering 200% of their combined share value. This indicates that investors anticipate high future earnings for Apple compared to those of European Telecommunications. OTT services (such as search engines, e-payment systems, cloud computing services and news aggregators) are complementary to Orange’s Internet access and connectivity services. However they also compete; Orange provides electronic communication services such as SMS and calls, while OTTs provide instant messaging and video streaming services. Microsoft makes revenue on software, which it uses to subsidise Skype. Likewise, Google makes its revenue on Search functions and then heavily subsidises Youtube. Orange however makes its money on electronic communication services to subsidise its access and connectivity services. Quite simply, the revenue generating service for Orange is in competition with the subsidised services of the OTTs. To compound Orange’s disadvantage, OTTs and Orange have to answer to different regulators. Orange and its industry rivals are incentivised to ensure competition, as there is the constant threat of market intervention from Competition Authorities who consider Electronic Telecommunications a priority. Lighter regulation for OTTs has been favourable for their relative performance and has allowed a dominant few to obtain market power. Evidently Orange is in favour of common regulations between telecommunications and OTTs, which it sees as necessary for fair competition. They would argue this reform would be welfare enhancing, as it would increase their investment in infrastructure. The Internet is a major part of the World Economy; nevertheless a definitive solution to the Net Neutrality issue is yet to be found. Net Neutrality is likely to be a major issue in both industry and academia in the coming years. References Jullien, B. Congestion Pricing and Net Neutrality. Wallsten, R. H. The Economics of Net Neutrality. 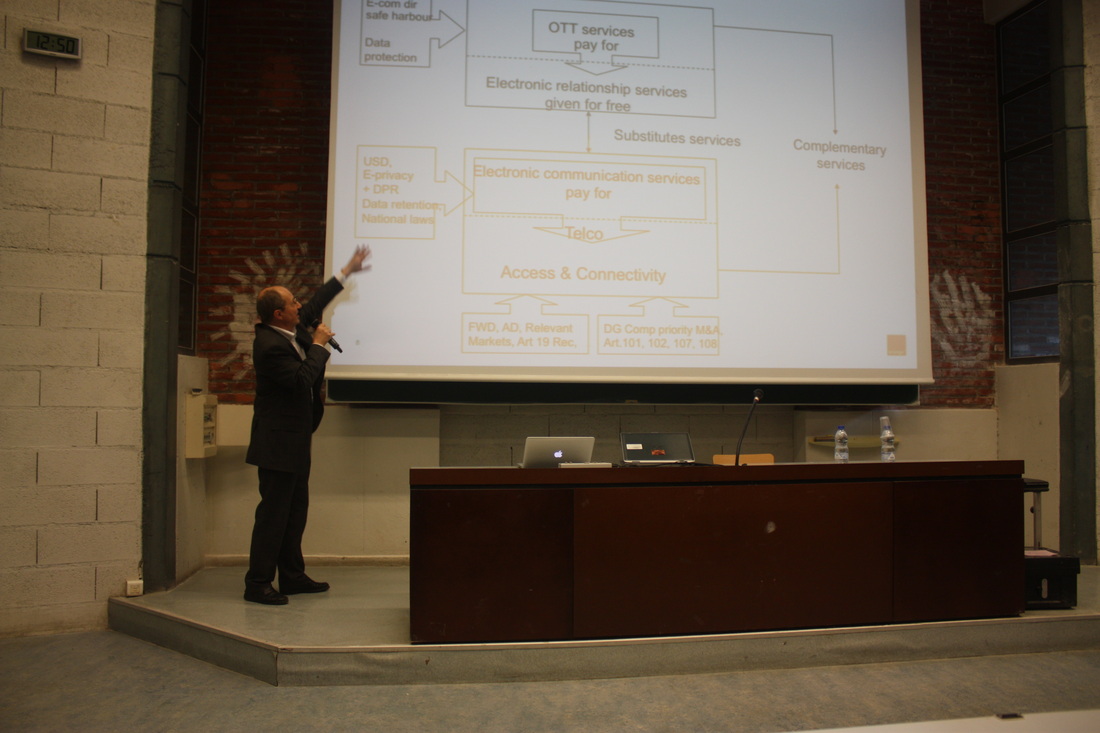
 Had someone asked me a few years ago about my career goals for the future, I would have said: I would like a masters degree in economics from a prestigious foreign university and afterwards I would like to work for the Chilean Competition Agency. Today, both of my dreams are fulfilled and I owe it all directly or indirectly to TSE.
In 2010 I made up my mind to studying abroad and I did not want to wait anymore, so I applied to TSE. They admitted me for September 2010. My arrival in Toulouse was wonderful: there I had the opportunity of living in a country totally different from my own. It was an amazing experience. I really loved the city: so many nice places, coffee shops and boulangeries. I also had the pleasure of meeting new colleagues from around the world. The biggest challenge was balancing the charms of the city and the requirements of a very time consuming and demanding academic program. A roller-coaster is an appropriate metaphor for being enrolled at TSE: you cannot get off during the trip and the speed goes faster and faster until the end comes. Our program was divided into quarters, in which the ten weeks of classes went by really fast. You did not have time to even realize when the exam period arrived. You had to take all the exams during the same week; when at last you had a little break, and at least you were able to “keep your head out of the water,” the next quarter had already started and soon the next exam period as well. I will never forget the facebook posts of my classmates during exam period: "TSE: Torture School of Economics", "Stockholm Syndrome", and other funny sentences trying to illustrate the hard times that we had studying. Undoubtedly, a year in TSE is not a very easy one. However, despite the effort I really think that it is worth it. I cannot find the words to explain how wonderful is to be exposed to and work with teachers who are at the forefront of their subjects. Courses like Information Economics (micro 2) or Incentives and Regulations, and all the knowledge gained from them, are just amazing. TSE also gives you complementary skills such as learning to work under pressure, to prioritize and to focus effort towards one's comparative advantages (because it is impossible to do everything). What can I say about signaling when you are graduated from TSE? ... The opportunities  In late July 2010, I arrived in Toulouse a freshly (or, judging from my rumpled travel attire, not-so-freshly) imported tabula rasa from the other side of the Atlantic. I had only a vague notion of what it would mean to study in the Master 2 program at TSE, and even less of an idea about what to expect from life in southern France (I had neglected to bring a winter coat, for example). When I departed from Toulouse in early August of the following year, the city and the university had left on me an indelible impression: rigorous preparation for my future work, fond memories, and cherished new friendships.
TSE's M2 program impressed me with three aspects in particular. First, the program presents a solid foundation of the fundamental concepts in modern economics. It is (almost surely) impossible to internalise everything the first time around -- especially given the furious pace of the M2 year -- and our specific academic backgrounds and study habits will affect the benefit we can derive, but the ideas presented and the training we receive will invariably serve us well. Second, TSE exposes even the most bookish among us to diverse cultures, ideas, and experiences. Finally, TSE enables us to study among brilliant minds. You have been granted access to an élite environment: At the blackboard in front of you, current leaders in the field; in the chairs surrounding you, future academics and practitioners. Following my year at TSE, I was accepted into the economics Ph.D. program at Rice University in Houston, Texas, where I am currently pursuing my studies and research. With Rice's qualifying exams safely behind me, my immediate academic goals are to write the strongest doctoral thesis I can and to serve as an inspiring and useful resource to others as colleague and TA. Ultimately I aspire to serve as a university professor, continuing the tradition of conducting quality research and extending knowledge to a wide audience. Allow me to end with a few pieces of advice, what the present me would have told the rumpled-clothed incoming student that was me two years ago. (1) Work hard, work together. At TSE, courses are rigorous and standards are high; steel yourself for a challenging year. Studying with your colleagues will make the year less overwhelming and more rewarding. (2) Look for ways to share. Contributing to the education of others and to the TSE community will enrich both your own experience and the experience of those around you. (3) Get to know your peers and professors. The people at TSE are unequivocally its greatest asset. (4) The secretaries -- for my year, Mmes Schloesing, Grizeaud, and Delorme -- are among these people. Thank them for their work. (5) Take advantage of opportunities outside the classrooms and library. Yes, you are at TSE to study economics and to study it doggedly. But it would be downright un-French to pass the entire year without a little joie de vivre. Some of my fondest memories include running along the Canal de Brienne and the Garonne, singing with choirs at Université Paul Sabatier, attending the weekly visites-conversations for students at the Musée des Augustins, mixing with M1 and DEEQA students in the Saturday-morning French language course, and learning how to dance in one of the UT1 sports classes. (6) Enjoy the TSE experience. It will be demanding. It will, at times, seem futile. And with a supportive group of friends, a strong work ethic, and committed determination, it will be worth it. This year you find yourself among brilliant and interesting people who share your passion for economics and your desire to enjoy life. Profit well from the year ahead, and bonnes études!  When I decided to pursue a masters in 2010, the Economics of Markets and Organizations (EMO) programme at the Toulouse School of Economics (TSE) was the obvious choice for several reasons: the faculty at Toulouse is made up of many renowned economists who are leaders in their fields; the programme focuses on my interest area of applied microeconomics, including industrial organization, competition policy and economic regulation; and I was fortunate to be awarded a scholarship from TSE that made it a financially viable choice. Going to Toulouse benefitted me in many ways, and I am glad to be given this space by the editor to share my experience and express my heartfelt “merci” for what the city and the school have given me. At the same time, I hope that the reader in Toulouse will also find your time there to be immensely rewarding too.
The year of studying in Toulouse was, in all honesty, not an easy breeze at all. Classes were unrelentingly rigorous. However, TSE professors are as high-quality teachers as they are researchers, and the classmates never held back in helping and pushing each other forward. It was the dual presence of both the challenging and encouraging elements in that TSE academic environment that made learning a most fruitful and fulfilling one. After Toulouse, I resumed my previous job at the Civil Service College of Singapore, where my work involves putting together economics courses and lectures to advance economics thinking in Singapore’s public sector. At TSE I developed useful analytical and research skills that are valuable in my current job. Moreover, TSE has affirmed my interest in economics research, prepared me well to continue to a PhD when I eventually make that move, and provided wider opportunities to move forward because of the high-standing reputation it has around the world. The intense pace of studies at TSE and the inevitable difficulties of living in a place of foreign language and culture were mitigated by the fact that I was in a mesmerizing part of France, where the sights are wonderful and the atmosphere is idyllic and relaxed. I met some of the most brilliant yet humble people from around the world that made a difference to my social life, and I experienced a way of life that made a difference to my perspectives on happiness. These are perhaps the most valuable take-homes that can come only uniquely from Toulouse. Interview with Antoine-Augustin Cournot (1801-77) by M Carling, Master 2 student, 2011-20122/9/2013  French economist and mathematician. Cournot was the first economist who, with competent knowledge of both subjects, endeavoured to apply mathematics to the treatment of economics. His main work in economics is Recherches sur les principes mathématiques de la théorie des richesses (1838; Researches into the Mathematical Principles of the Theory of Wealth). His primary concern was the analysis of partial market equilibrium, which he based on the assumption that participants in the process of exchange are either producers or merchants whose goal is the maximization of profit. He therefore ignored the concept of utility. His most important contributions were his discussions of supply-and-demand functions and of the establishment of equilibrium under conditions of monopoly, duopoly, and perfect competition; his analysis of the shifting of taxes, which he treated as changes in the cost of production; and his discussion of problems of international trade. Carling: Why did you decide to be an economist?
Cournot: I'm not an economist. I'm a mathematician. Carling: Why, as a mathematician, did you decide to work on economic questions? Cournot: From Xenophon to Adam Smith, economics suffered from a lack of mathematical rigor because predictions were not concrete enough to be rejected by empirical data. In the words of Wolfgang Pauli, they were “not even wrong.” A theory which doesn't make falsifiable predictions is worse than a theory which has been disproved. Xenonphon's Oeconomicus is an interesting read, but it doesn't reflect economic reality any better than Aristotle's physics represents physical reality. The introduction of mathematics to economics was just as important as the introduction of mathematics to physics by Copernicus, Galileo, Newton, and others. Carling: Do you think your contributions to economics were as important as Newton's contributions to physics? Cournot: Does anyone think otherwise? Carling: If your contributions to economics have been so important, why have you not been awarded the Nobel Prize? Cournot: It's true that I've made important original contributions to economics, that my publications are widely cited, and that my protégés are widely cited, but my death was a disqualification. If I were still alive, I would win the prize. Carling: What do you think was your most important contribution to economics? Cournot: My most important contributions to economics were the invention of game theory and convincing Léon Walras to become an economist. Carling: Whose recent work on game theory do you find interesting? Cournot: Nash's formalization and generalization of what I call Cournot Equilibrium has been important in facilitating the wide application of Cournot Equilibrium. If you mean very recent work, asymmetric information games have helped to make game theory applicable to additional fields, such as international conflict resolution and, more recently, law. Carling: What do you think of Bertrand's duopoly model? Cournot: Bertrand is a [deleted] id**t! Everyone knows that firms set quantities, not prices. For example, consider my iPad: Apple place orders with the manufacturers in China and then they have to sell them at a price the market will bear. Carling: Fair enough, but Apple also set a fixed price for iPads and then place orders with the manufacturers every month which vary depending on how many have sold. Cournot: Bertrand is still a [deleted] id**t! If Bertrand's duopoly model were correct, then duopolies would be perfectly competitive, which is thoroughly refuted by the empirical data. Carling: Do you have any regrets? What would you do differently if you were still alive? Cournot: I regret not spending more time mentoring my students. While my work was eventually influential, I could have accomplished more if I had put more effort into helping students develop their research and writing skills. Carling: What advice do you have for TSE students? Cournot: Take a broad view and collaborate with colleagues from other disciplines. There are interesting opportunities for economic modeling based on ideas from biology, fluid dynamics, engineering, and cognitive neuroscience. There are also interesting opportunities to apply ideas from economics to other fields such as law, political science, and network engineering. Carling: Thank you.  Intangible assets, which have grown rapidly on the balance sheet of firms in the last twenty years, are key sources of innovation and growth. They represent for instance more than 80% of US firms’ assets in the Hi-Tech or Pharmaceutical sector. In the article entitled “Takeover Discipline and Asset Tangibility”, I empirically study whether takeover vulnerability has a different effect on the performance of tangible and intangible firms. Background The corporate finance literature extensively mentions the role of takeovers in disciplining managers. Empirical evidence shows that managers are likely to be replaced in case of a takeover and that takeovers are more likely to occur in case of bad performance. The prospect of being fired following a takeover pushes ex ante managers to exert effort. Jensen in the 1980s has been a strong advocate of this positive view of takeovers, which received additional support in the seminal paper of Gompers, Ishii and Metrick (2003): they show that firms with less takeover defenses have on average higher firm value and equity returns. Results I use data on takeover defenses which are available for around 1500 listed US firms between 1990 and 2007, and construct the entrenchment index proposed by Bebchuk, Cohen and Ferrel (2009) which goes from 0 to 6 depending on the number of takeover defenses (among Classified Boards, limitations to amend bylaws, to amend the charter, supermajority for merger, poison pill and golden parachute) the firm has. I then measure firms’ asset tangibility with the ratio of property, plant and equipment over total assets, and rank firms as “tangible” or “intangible” firms. I obtain two results: first,, poor takeover vulnerability (high value of the entrenchment index) is associated with poor performance, but only so for intangible firms. If takeover discipline matters relatively more for the performance of intangible firms, shareholders of intangible firms are likely to be more active in fighting against the adoption of takeover defenses than shareholders of tangible firms. Consistent with this claim, I find that intangible firms have on average less takeover defenses than tangible firms. Antitakeover Laws Firm-level takeover defenses are likely to be endogenous. In particular, the positive association between takeover vulnerability and performance might be driven by the fact that managers of firms with low performance have incentives to adopt takeover defenses. In order to address endogeneity, I use the adoption of business combination (BC) laws as an exogenous shock to the market for corporate control. These laws were passed in 30 US states between 1985 and 1991 and generally impose a moratorium on mergers and asset sales between a large shareholder and a firm for a period usually ranging between three to five years after the shareholder’s stake reaches a pre-specified threshold. This moratorium makes in practice any hostile takeovers almost impossible. As previous studies, I find that firms’ operating performance drops after the laws’ passage. Then, once firms are sorted into tangible and intangible firms, I find that intangible firms protected by BC laws experience a significant drop in operating performance (around -1.4 percentage points) whereas tangible firms experience no significant effect. I obtain analogous results with event studies around the dates of the first newspaper reports about the BC laws. Stock prices react negatively to the announcement of BC laws only for intangible firms: cumulative abnormal returns equal -0.8% and are significant for intangible firms, whereas they are small and insignificant for tangible firms. Debt Discipline These findings suggest that takeover discipline matters only for intangible firms. My favorite explanation for these results is that tangible firms are already disciplined by debt. A large literature emphasizes the role of debt in mitigating agency problems between managers and investors. 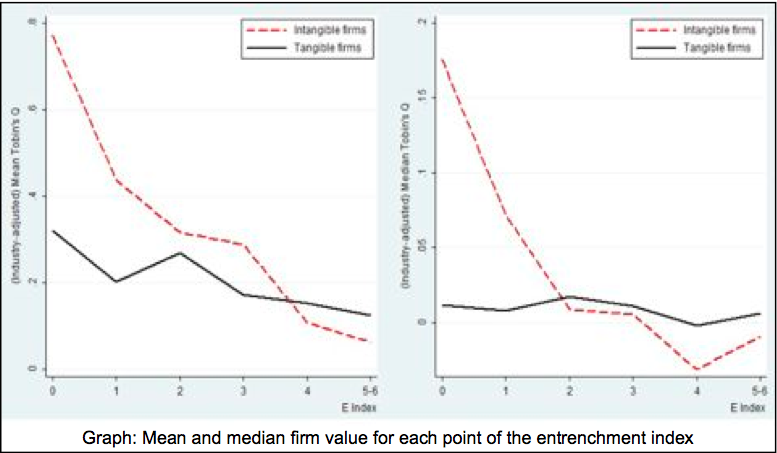 First, debt limits managerial discretion by forcing the firm to disgorge cash flows. Debt discipline also rests on debtholders’ ability to exercise control when the firm defaults on its debt contract. Managers dislike default because they generally experience large salary and bonus reductions in that case. Ex ante, this gives them incentives to exert effort in order to avoid default.
However, debt is not an appropriate governance mechanism for intangible firms. Intangible firms have low liquidation values and low asset redeploy ability, and thus they might prefer to avoid debt and delegate monitoring to the market for corporate control. Alternative Stories I also examine another story which potentially explains the results. Takeover defenses or BC laws make takeovers less likely and thus reduce the probability that shareholders will receive premium as targets of an acquisition. If mergers and acquisitions (M&As) create on average more value in intangible than in tangible industries, this might explain for instance why stock prices of intangible firms react more at the announcement of a BC law. To address this point, I look directly at a sample of M&As: I find no evidence that industry asset tangibility drives the profitability of an acquisition. An alternative force is information asymmetry. The relative scarcity of public information on intangible firms makes good corporate governance a relatively more important issue for investors of these firms. Policy Overall, the evidence indicates that the appropriate disciplinary mechanism between debt and takeovers depends on the characteristics of the firm assets. This has important implications for governance design, suggesting for instance that owners of intangible firms should avoid installing takeover defenses at the IPO. References Bebchuk, Lucian A., Alma Cohen, and Allen Ferrell, 2009, What matters in corporate governance? Review of Financial Studies 22, 783-827. Bertrand, Marianne, and Sendhil Mullainathan, 2003, Enjoying the quiet life? Corporate governance and managerial preferences, Journal of Political Economy 111, 1043-1075. Field, Laura C., and Jonathan M. Karpo , 2002, Takeover defenses of IPO firms, Journal of Finance 57, 1857-1889. Gompers, P., J. Ishii, and A. Metrick, 2003, Corporate Governance and Equity Prices, Quaterly Journal of Economics 118, 107-155. Giroud, Xavier, and Holger M. Mueller, 2010, Does corporate governance matter in competitive industries? Journal of Financial Economics 95, 312-331.  Roberto Pancrazi received his PhD (in economics) from Duke University in 2010. Since then, he is an assistant professor (Junior Chair) in TSE. His research is primarily oriented towards empirical macroeconomics, econometrics and finance. He is currently teaching the DEEQA courses “Quantitative Techniques in Economics” and “Financial Macroeconomics” Imagine that you were a little child receiving $100 from your grandmother in 1946. Suppose also, that you were a wanna-be economist who tried to do the best long-run investment decision at the very early stage of your life. At that time, say, you had two options: you could have invested in safe risk-less government bond, or in a riskier stock market. What was the best option? What would you have done?
If you had invested the $100 in government bonds, it would have become (adjusting for inflation) $153 65 years down the line. Instead, if you had kept your money in stocks, it would have become $6473. In other words, historically, investing in stocks gave a 8.2% average annual return, whereas the government bonds only a 0.7% average annual return. The difference in returns between a safe asset and a risky asset can easily be explained with the following argument: given their risky nature, stocks are able to attract investors only if they are compensated with a risk-premium, which is an additional price that investors ask for bearing the risk of holding unsafe assets. In fact, if the returns of government bonds and stocks were the same, no investor would hold stocks. However, it is very important to clarify what "risky" means. It is not possible to predict the return of stocks, given the underlying uncertainty in the performance of the firms. On the other hand, investors know what is the return of the government bonds once they buy them (ignoring possible defaults). Investors also use assets as an insurance device, hence they evaluate the performance of the assets relative to other sources of wealth. Suppose you are hit by an unexpected negative shock on your income, if for example you lose your job. In that moment, you could sell your assets to get resources to use as a substitute for the reduced income. However, if the value of assets is low at the time, these assets are even less appreciable than assets that have low value in "good times". In other words, investors care about the degree of co-movement of asset prices and their consumption. With this notion in mind, we should ask the following question: what can rationalize a historical 7.5% equity premium? Is the risk associated with stocks large enough to justify such an equity premium? This question was proposed by Mehra-Prescot in 1985. By using a standard Consumption based Asset Pricing Model (CAPM) with agents having constant relative risk aversion (CRRA) utility function, they showed that only a very high coefficient of risk aversion (greater than 50) could generate an observed value of the risk premium. Plausible values of the relative risk aversion are thought by economists to be less than 3. This is the equity premium puzzle: real investors in real world value risk as requiring a 7.5% premium with respect to safe assets. However, macroeconomic models need agents to be adverse to risk at an implausible degree to rationalize the observed equity premium. A large branch of macro-finance literature have been trying to study departures from the standard CAPM model in order to explain the equity premium with a lower and plausible level of risk aversion. In particular, most of the literature has explored how different preferences and different assumptions on consumption data generating process might help on solving the puzzle. I will briefly give you a summary of these two lines of research. The standard CRRA model assumes time-separable utility across periods. That means that the utility an agent obtains in a period depends only on the consumption in that period. Economists have introduced non-separability in order to solve the equity premium puzzle. For example Abel (1990) showed that habit in consumption with utility depending not just on the level of present consumption, but on its value relative to past consumption, can partially solve the puzzle. However, even with the assumption of non- separability, the risk aversion needed to generate the observed risk-premium is still very large. Instead, Epstein-Zin (1990) proposed recursive preferences, where an agent obtains utility from a non-linear combination of present consumption and future utility. These preferences have received a large amount of attention in the recent literature, given its ability to disentangle the coefficient of risk aversion from the inter-temporal elasticity of substitution (how much an agent like to smooth consumption across time). The tight relationship between these two parameters is one of the primary sources of the puzzle, thus it implies that the recursive preferences are good candidates to provide solutions to the same. A second line of research on the equity premium puzzle focuses on the assumptions on the data generating process. Then the puzzle can be formulated as the following: given the pattern of macroeconomic variables that we have observed in the last century, only an implausible value of risk aversion can generate the large risk premium. But what if there is something more than "what we observed in the data"? Barro (2006) proposed a model that is able to generate a large equity premium by assuming that the economy can be subject to rare disasters. A disaster is able to ruin the economy, but it happens with a very low probability. Even though in the post-war period there has not been a disaster, investors still take that probability into account. As a consequence, they require a large premium for bearing a risk, because holding the risky asset might be terribly bad when a disaster hits. On the other hand, Bansal and Yaron (2004) suggests that macroeconomic variables are characterized by a small (and hidden) component that is very persistent, the so called long- run risk. Therefore, when a bad shock hits, it has very long lasting implications. Agents are adverse to this small long-run risk which explains the large premium. To conclude, the macro-finance literature has been focusing on the equity premium puzzle for a couple of decades now. Explaining how to link macroeconomic variables with financial variables is challenging, but at the same time very important as the recent financial crisis reminded us. References - ABEL, ANDREW B., 1990. “Asset Prices Under Habit Formation and Catching Up With the Joneses”. American Economic Review, May, 80(2), pp. 38–42. - Bansal, R., Yaron, A., 2004. Risk for the long-run: a potential resolution of asset pricing puzzles. The Journal of Finance, Vol. LIX, No.4, August, pp. 1481- 1509. - Barro, R.J, 2006. “Rare Disasters and Asset Markets in the Twentieth Century.” Quarterly Journal of Economics, 121(3): 823–66. - EPSTEIN, LARRY G. AND ZIN, STANLEY E., 1990. '‘First Order’ Risk Aversion and the Equity Premium Puzzle,” Journal of Monetary Economics, 26(3), pp. 387–407. - Mehra, Rajnish and Prescott Edward C., 1985. “The Equity Premium: A Puzzle”, Journal of Monetary Economics, 15(2), pp. 145–61.  Adam Jaffe is the Dean of Arts and Sciences and Fred C. Hecht professor in Economics at Brandeis University. At the same time he is a research associate at the National Bureau of Economic Research. He holds a PhD degree in economics from Harvard University and he specializes in industrial organization, environmental economics, technological change and innovation. Climate change is one of the largest policy challenges of the 21st century. Like most economists, I believe that the primary policy response to this challenge must be to raise the price perceived by private agents to be associated with the emission of so-called greenhouse gases (“GHG”) through taxation or regulation, in order to create the appropriate economic incentives for such agents to align all of their economic activities—production, consumption, and investment of all kinds—with the social objective. In this article, I argue that such “carbon-price policies” should be complemented by “technology policy,” i.e. policies designed to foster the creation, improvement and diffusion of new low-GHG technologies by pathways other than the incentives created by a higher price on GHG emissions.
The problem is big. There is considerable disagreement about how large a reduction in world emissions is needed to avoid catastrophic climate impacts. Resolution of this debate is not necessary in order to conclude that the challenge is enormous, and unlikely to be met solely by making carbon emissions more expensive. Suppose we wished only to stabilize—not reduce—world emissions by 2050, while still allowing world GDP to grow at a modest 2.5% per year in the interim. Simple arithmetic tells you that this would require about a 60% reduction in the ratio of world emissions to world GDP over about forty years. How big is this? Since the “oil crisis” of the early 1970s, the ratio of world oil consumption to world GDP has been reduced by about 40%, as the price of oil has increased by more than a factor of six. Now, “petroleum” is a subset of “fossil fuels,” so economic theory tells us that the price elasticity of demand for petroleum has to be larger than the price elasticity of demand for fossil fuels. This suggests strongly that it would require an enormous increase in the effective price of fossil fuels—something like a ten-fold increase—to stabilize or potentially reduce carbon emissions. Even assuming the current policy impasses over climate change are eased, effective price increases of this magnitude seem very unlikely. Theory says two market failures require two policy instruments. At a conceptual level, the justification for carbon policy is that there is a negative externality associated with GHG emissions; imposition of a carbon tax or permit system internalizes this externality. But there are wholly distinct positive externalities associated with technological innovation and diffusion. Carbon policy cannot internalize these, leaving a separate policy gap to be addressed. These externalities flow generally from the fact that knowledge is a public good. The two characteristics of a public good are that it is non- rival in consumption, and that it is difficult to exclude people from benefitting from the good if anyone uses it. Knowledge clearly has the first property, and has the second property to varying degrees depending on the situation, leading economists to talk about the problem of “imperfect appropriability” of the returns to new technology. This appropriability problem is inherent both in research and development, and in the diffusion of new products, because the production and use of new products itself generates knowledge about the production process and the best product designs. This means that in the absence of policy intervention both the research process and the diffusion of new technologies will be undersupplied by the market. It’s not clear what the needed transformation will look like, but history suggests that it won’t happen without government support. Given the magnitude of reduction in GHG intensity that is needed, we need to think about a profound transformation in the social-economic- technological system by which we heat and cool, move around and produce things. It is not clear that there is a historical analogy for change of this magnitude, but I submit that digital computation and communication have been improved over the last four decades in a way that is qualitatively comparable to the change we need in our carbon system. And I think the analogy is instructive. We do not calculate or communicate today with improved versions of the instruments that were available for these purposes in 1970. We use a system whose backbone infrastructure and individual components did not exist, and in important aspects were not imagined, in 1970. If we are going to meet the climate challenge, we are going to have to effectuate a comparably broad and deep reconstruction of our energy and industrial systems. The information technology and digital communications transformation was fostered in significant ways by public policy around the world. Particularly in the U.S., the government invested in both research and in acquisition of early-stage technology projects related to defense, space, and communications that accelerated technology development significantly. Other, less extensive technological transformations such as nuclear power, commercial aviation and health care have analogous histories of government research and technology purchase in support of technological development. Current efforts do not match the importance of the problem. Current public spending on energy research, development and demonstration is about $15 worldwide. This is less than the U.S. alone spends on health sciences research. Policies such as tax credits for electric cars, special tariffs for electricity from renewable sources, and “portfolio” standards that require electricity generators to derive minimum fractions of their power from non- carbon sources have had some impact in expanding the markets for hybrid cars, windmills and solar power. But these policies are largely uncoordinated, and their future is uncertain as fiscal austerity becomes more and more acute. Evaluation is essential. It would be nice if economists nd other experts could advice policy makers on which of the various mechanisms that have been used to foster technology development are the most effective. Unfortunately, careful evaluation of such programs— which requires attention to the incremental impact of the policy over what would have occurred in the absence of the policy—is rare. This is an area in which economic research could have a beneficial impact. Conclusion. The current divisive debates about climate policy, and the general focus on fiscal austerity around the world make near-term policy innovation in this area unlikely. But climate change is a long-term problem. Academic scholars should analyze it from a long-term perspective, developing the methods and data that will facilitate better policy over the long term. (This article is a condensed version of an article “Technology Policy and Climate Change” that is forthcoming in the journal Climate Change Economics.) Selected Further Reading: Griliches, Zvi, 1992. “The search for R&D spillovers,” The Scandinavian Journal of Economics Henderson, Rebecca and Richard Newell, eds., 2011. “Accelerating Energy Innovation: Insights from Multiple Sectors,“ University of Chicago Press Jaffe, Adam B., 1998. “The Importance of ‘Spillovers’ in the Policy Mission of the Advanced Technology Program,” Journal of Technology Transfer, Summer Jaffe, Adam B., 2002. “Building Programme Evaluation into the Design of Public Research-Support Programmes,” Oxford Review of Economic Policy Popp, David, Richard Newell and Adam Jaffe, 2010. “Energy, the environment, and technological change,” in Hall and Rosenberg, op cit |
Archives
Octobre 2016
Categories
Tout
|
 Flux RSS
